Technical Analysis for Oil Trading

In the dynamic world of oil trading, technical analysis serves as a powerful tool for making smart, data-driven decisions. By understanding and applying these techniques, traders can maximize their earnings and navigate the volatile oil markets with greater confidence.
Key Technical Analysis Tools for Oil Trading
1. Moving Averages
Moving averages help smooth out price data to identify trends. In oil trading, the 50-day and 200-day moving averages are particularly useful for spotting long-term trends and potential support/resistance levels.
2. Relative Strength Index (RSI)
The RSI is a momentum oscillator that measures the speed and change of price movements. For oil traders, RSI can signal overbought or oversold conditions, helping to identify potential reversal points in the market.
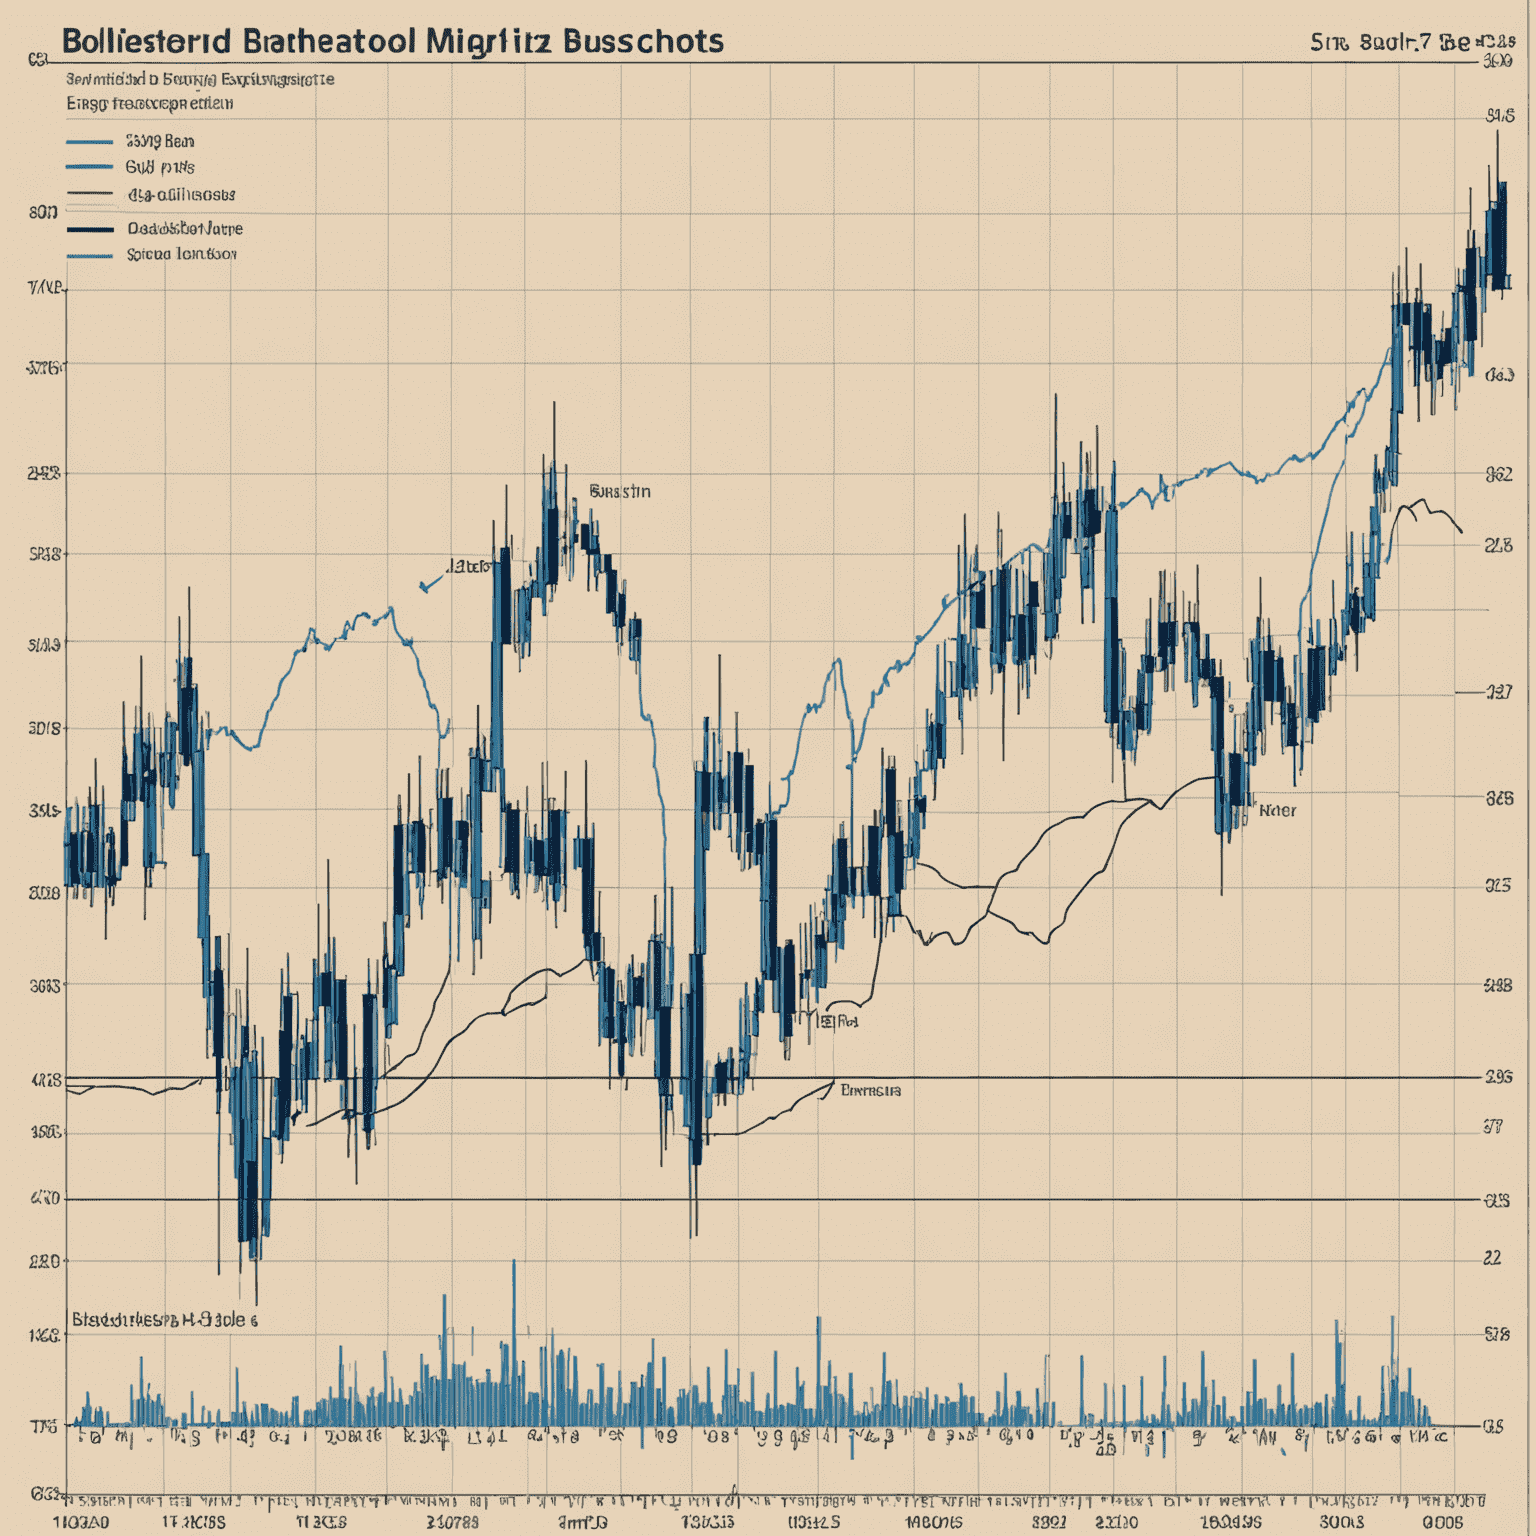
3. Bollinger Bands
Bollinger Bands consist of a middle band with two outer bands. They can help oil traders identify periods of high and low volatility, as well as potential breakout opportunities.
4. MACD (Moving Average Convergence Divergence)
The MACD is a trend-following momentum indicator that shows the relationship between two moving averages of a security's price. It's particularly useful for identifying potential entry and exit points in oil trades.
Applying Technical Analysis to Oil Trading
To make the most of these tools and maximize your earnings through smart oil trading strategies:
- Combine multiple indicators for confirmation
- Consider fundamental factors alongside technical analysis
- Practice with historical data before trading real money
- Stay updated on global events that can impact oil prices
- Develop a consistent trading plan and stick to it
Remember, while technical analysis can provide valuable insights, it's not infallible. Always manage your risk and never invest more than you can afford to lose in the volatile oil markets.
Conclusion
Mastering technical analysis for oil trading is a journey that requires patience, practice, and continuous learning. By incorporating these tools into your trading strategy, you'll be better equipped to make informed decisions and potentially increase your profitability in the oil markets.